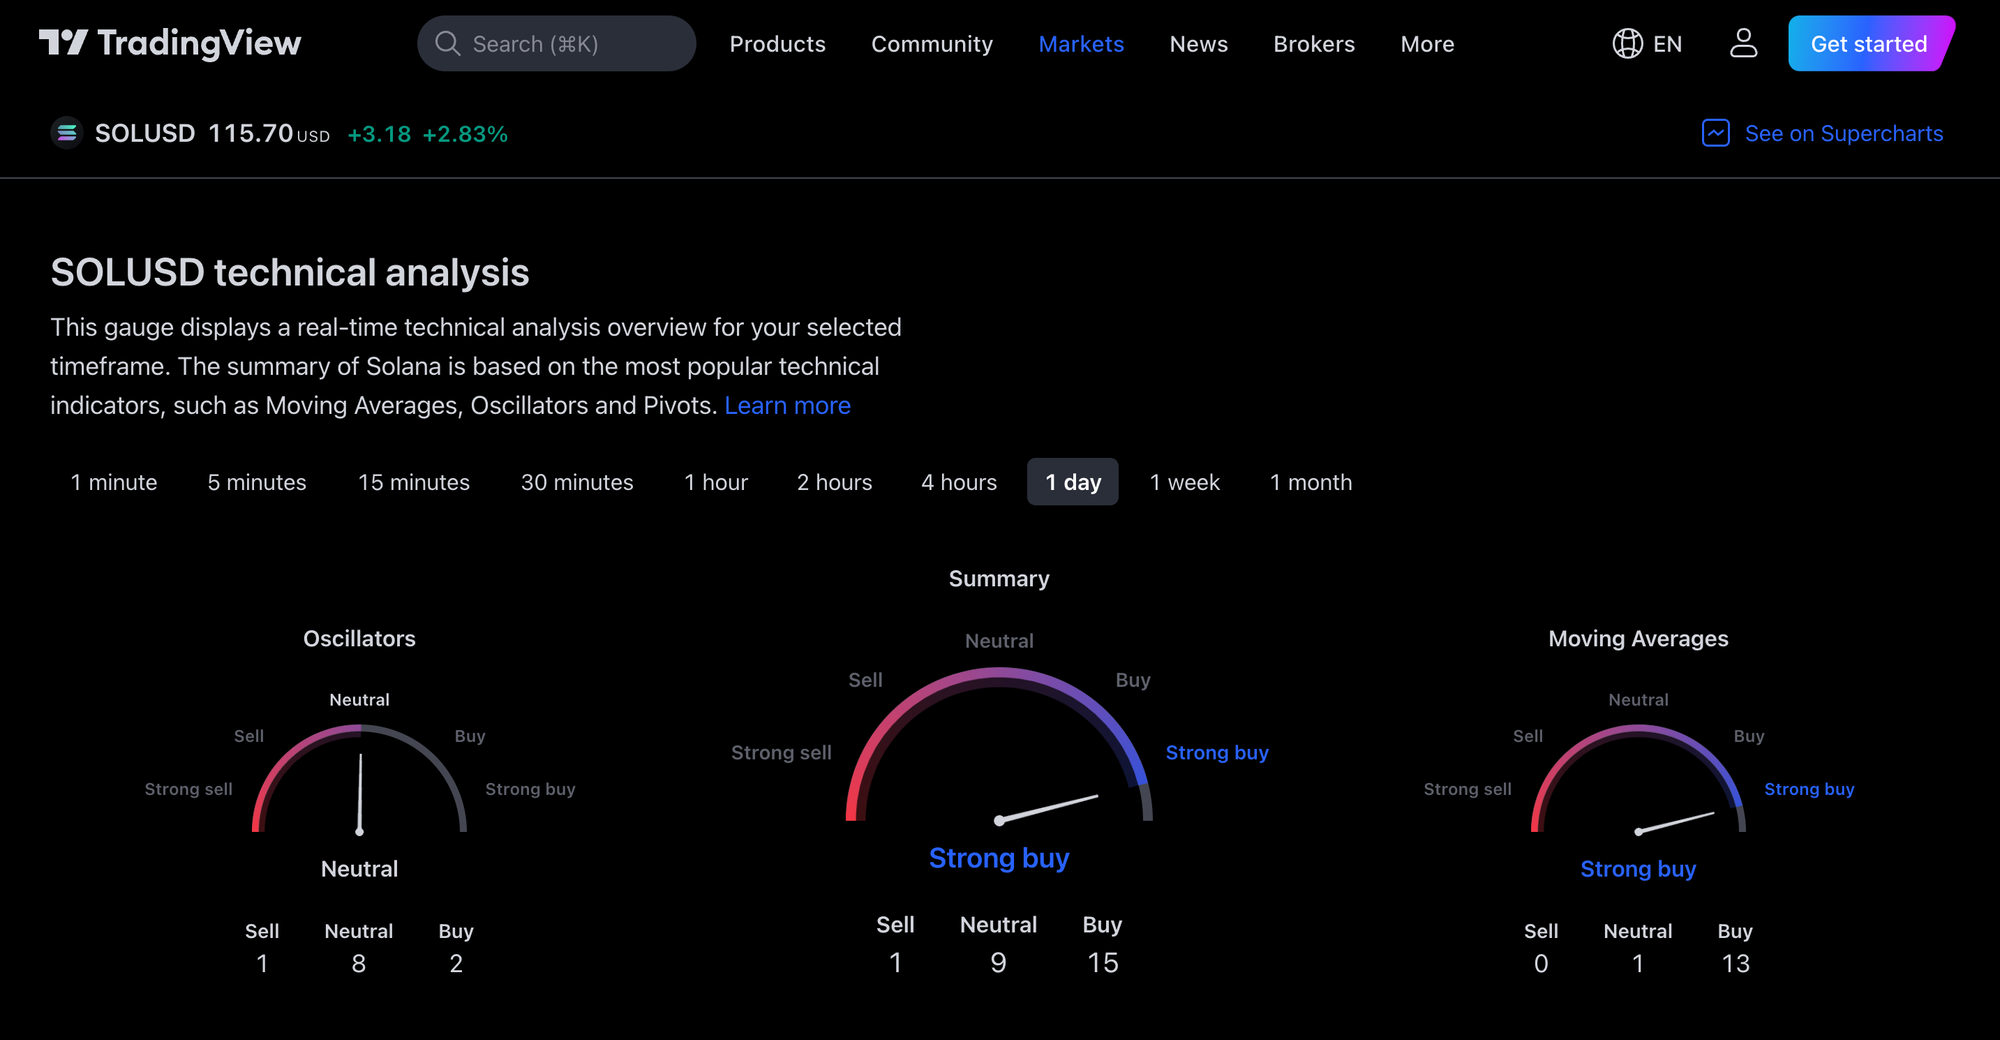
Oh man, Solana (SOL) has been on a wild ride, hasn't it? So, back in January, it took a nosedive down to 80 bucks. But guess what? It's clawing its way back up, nearly hitting the $125 mark that it was chilling at in December. It's like Solana's telling us, "You can't keep me down for long!" Right now, it's hanging around $117, and even though the whole trading scene saw a bit of a dip, Solana's market cap ballooned by 6% to a whopping $51 billion. TradingView has all the juicy details.

The vibe around Solana's getting a lot of thumbs up, mostly 'cause the big money folks - yeah, I'm talking about those institutional investors - are getting really into crypto. They're pouring cash into Bitcoin ETFs like there's no tomorrow, with a fat $4 billion rolling in by February 13. This is huge 'cause it's like saying crypto's all grown up and playing with the big kids now, giving a nice boost to Solana.
Bitcoin's been showing off too, breaking past $50,000 again after a little stumble. This bounce-back has been a good sign for Solana, helping it break past some tough spots, like that sneaky 61.8% Fibonacci level, and chilling around $117.
But, here's the kicker: Solana's got some hurdles to jump over, like the $120 and $125 marks. If it can leap over those, we might just see it cruising past $140 before February's out. The nerds looking at the charts and the MACD indicator are nodding their heads, saying the signs are all pointing to "Go."
However, if Solana can't muscle its way past $125 soon, we might see a bit of a backslide, with folks cashing out on the gains from that epic January comeback. But don't sweat it too much; the $100 zone is still a safe bet for Solana, making it a sweet spot for those looking to get in on the action at a good price. (NFA!!!)
Solana's looking pretty buff right now, with a lot of signs pointing to more gains on the horizon. But, you know, keep your eyes peeled for those resistance levels and market vibes that could shake things up. Stay sharp and DYOR frens.

21 Feb
Despite a recent dip below the $110 mark, Solana (SOL) has demonstrated resilience in February 2024's volatile market, reflecting cautious optimism among traders. Throughout the past month, SOL has maintained a bullish trend, signaling overall positivity in the market's trajectory for 2024. However, the cryptocurrency experienced a notable downturn on the final day of trading, ...
breaking below the crucial $110 support level.

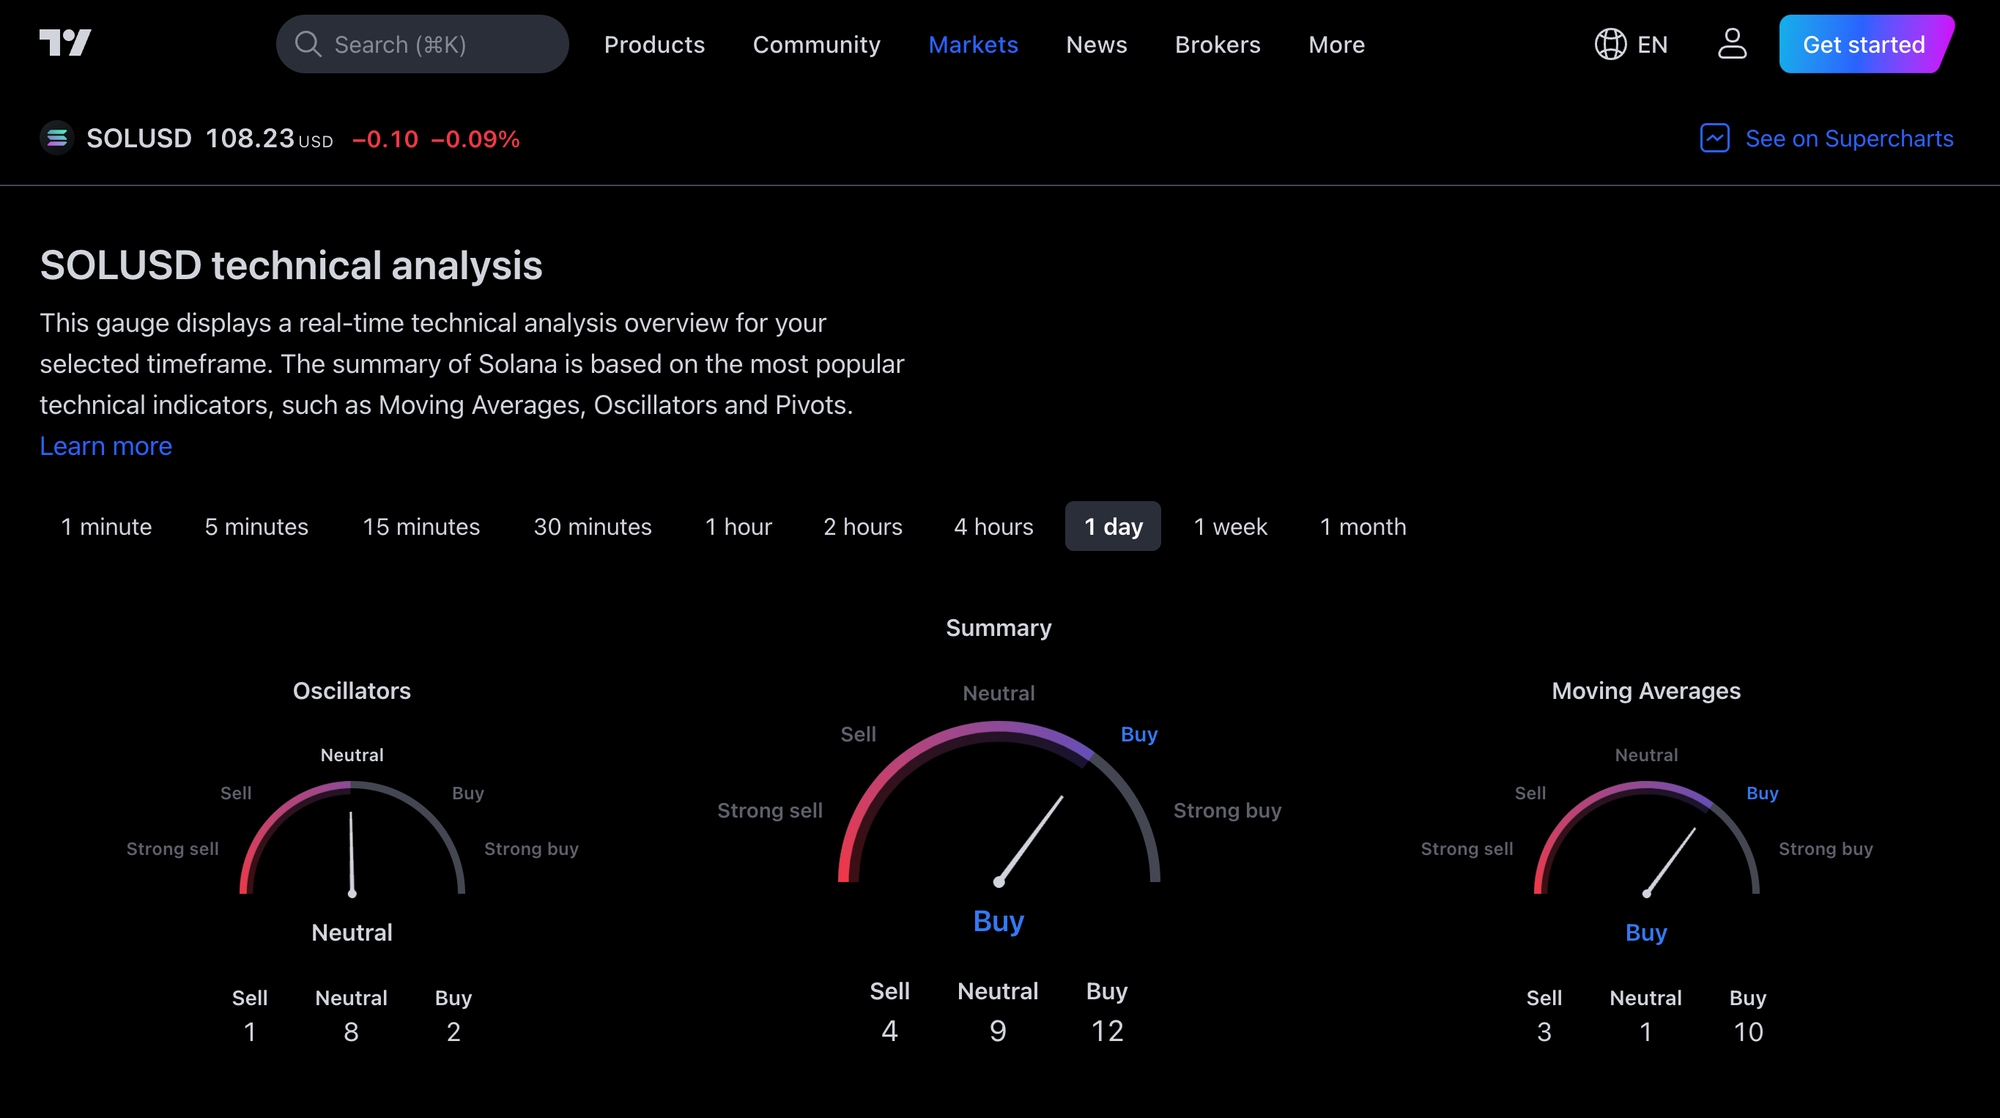
As of the latest update, SOL is trading at $108, marking a 6% decrease within 24 h.
A notable surge in trading volume, rising by 33% to $2.51 billion within the past 24 hours, indicates a growing interest among traders. Over the recent week, SOL's price has fluctuated between $113 and $107, suggesting a period of sideways movement confined within tightening trendlines.
The recent dip in SOL's price can be attributed to various factors, including potential buyer fatigue and a lack of enthusiasm among sellers to capitalize on gains, resulting in the price consolidating above key support levels. This consolidation phase follows a period of short-term price increases, indicating a cautious sentiment.
Collaboration with Filecoin
Solana's partnership with Filecoin marks a significant departure from centralized data storage methods, aiming to enhance the reliability and scalability of the Solana blockchain. By integrating Filecoin's decentralized storage solution, Solana seeks to improve accessibility and utility for a wide range of users, including infrastructure providers, explorers, and indexers. This strategic alliance underscores Solana's commitment to decentralization, reinforcing its position as a robust platform.
Future Outlook
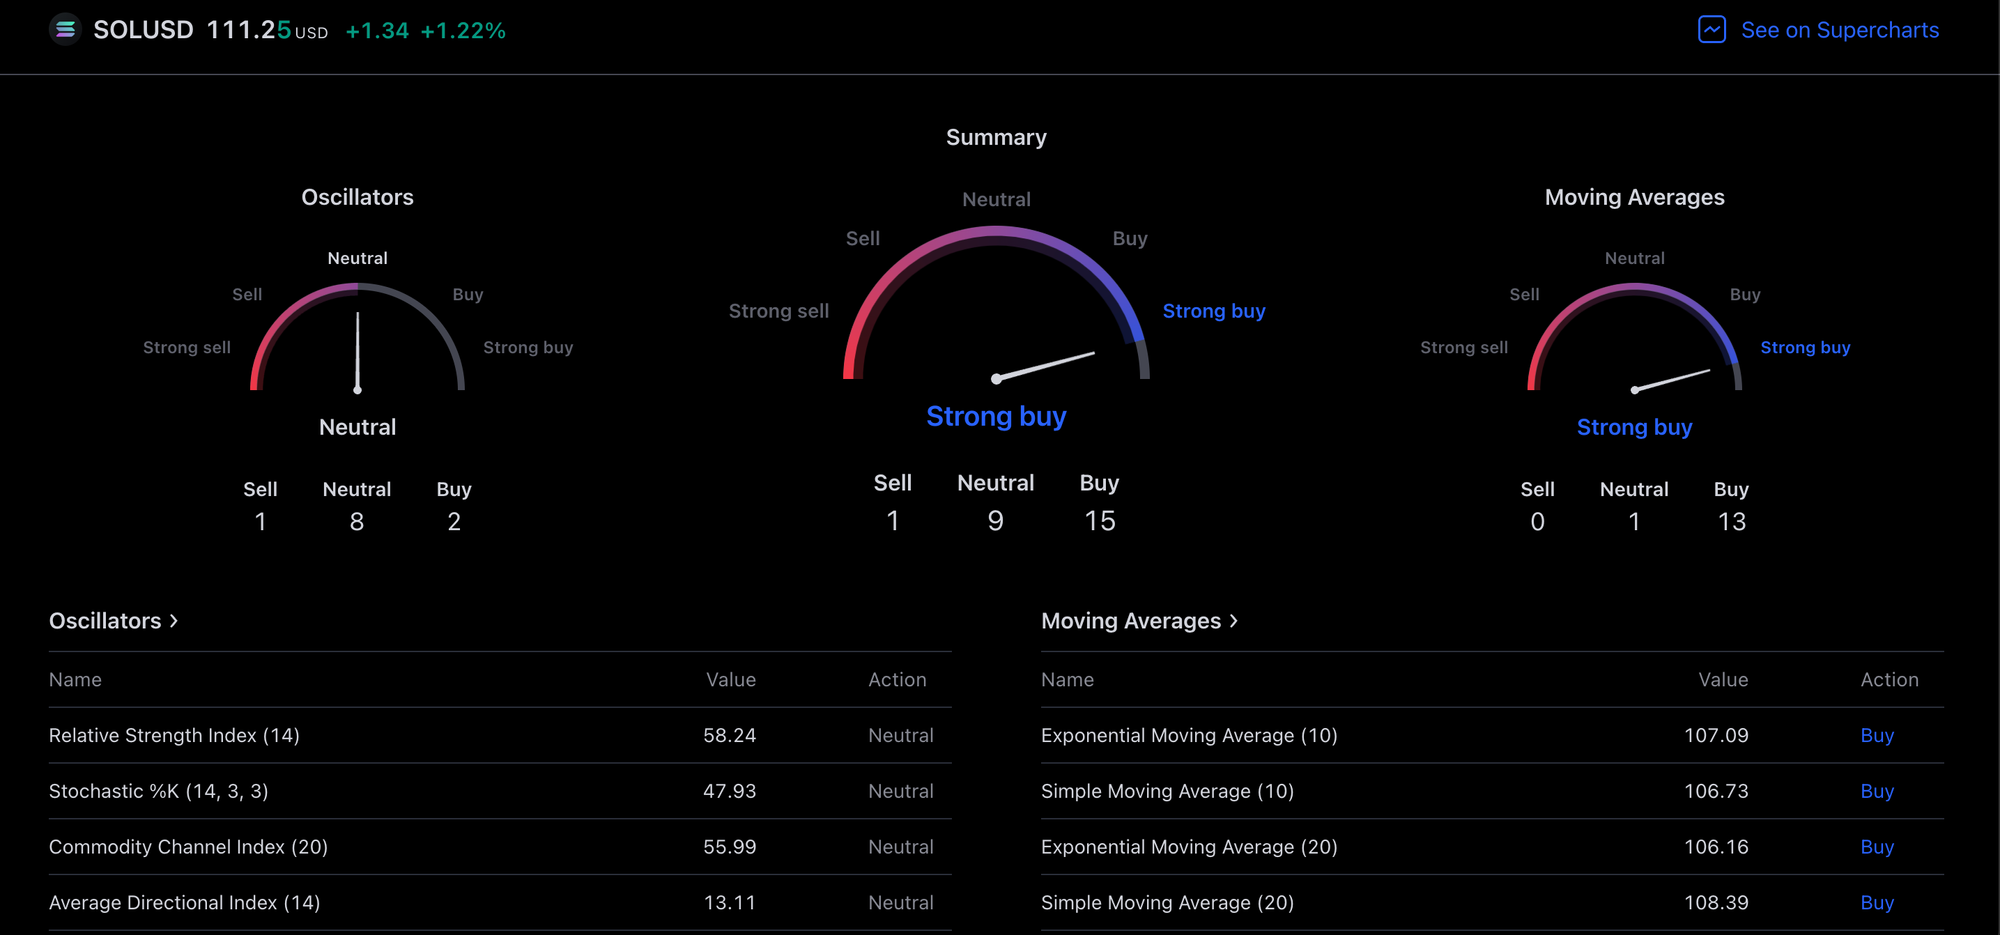
Looking at daily technical indicators, if the current downward trend persists, SOL's price may find support in the range between $106 and $100. Conversely, a resurgence of bullish momentum could propel SOL past the $115 threshold, potentially leading to further gains toward the $120 resistance level. Continued positive momentum could even see SOL testing the formidable $130 resistance mark. Currently, SOL's price movement is influenced by bullish forces, nearing the peak of an ascending triangle formation. However, the recent market consolidation has provided an opening for bears, pushing the price closer to critical support levels. While the Relative Strength Index (RSI) stands at a balanced 52, indicating short-term bearish momentum, the Chaikin Money Flow (CMF) index at 0.15 supports a bullish outlook. Negative trends in the 20 Exponential Moving Average (EMA) and the 50-EMA suggest the possibility of a bearish scenario in the short term.
27 Feb update
Solana stages a formidable comeback after momentarily slipping below $100.
- Principal Support Threshold: $104
- Principal Resistance Thresholds: $117, $126

In a swift response to its dip into double-digit territory, Solana has rallied, erasing some of its recent declines. This resurgence propels the price back into an aggressive stance, with sights set on the $117 resistance barrier. The moment Solana's valuation fell below $100, investors leaped at the opportunity to buy at a lower price. This surge in buying activity has effectively reversed the market trend, steering Solana into a bullish phase once more. This turnaround has elevated Solana's daily Relative Strength Index (RSI) above the 50-point mark, indicating a bullish outlook. This shift in market sentiment suggests that the rally could sustain its momentum. Solana is on track to reach the $117 mark. Surpassing this crucial resistance could pave the way to the next goal at $126.

