Smart Homes • Tech Integration • Bitcoin Strategy
Real Estate
Building the Future While Navigating Market Cycles
The Smart Home Opportunity in a Shifting Market
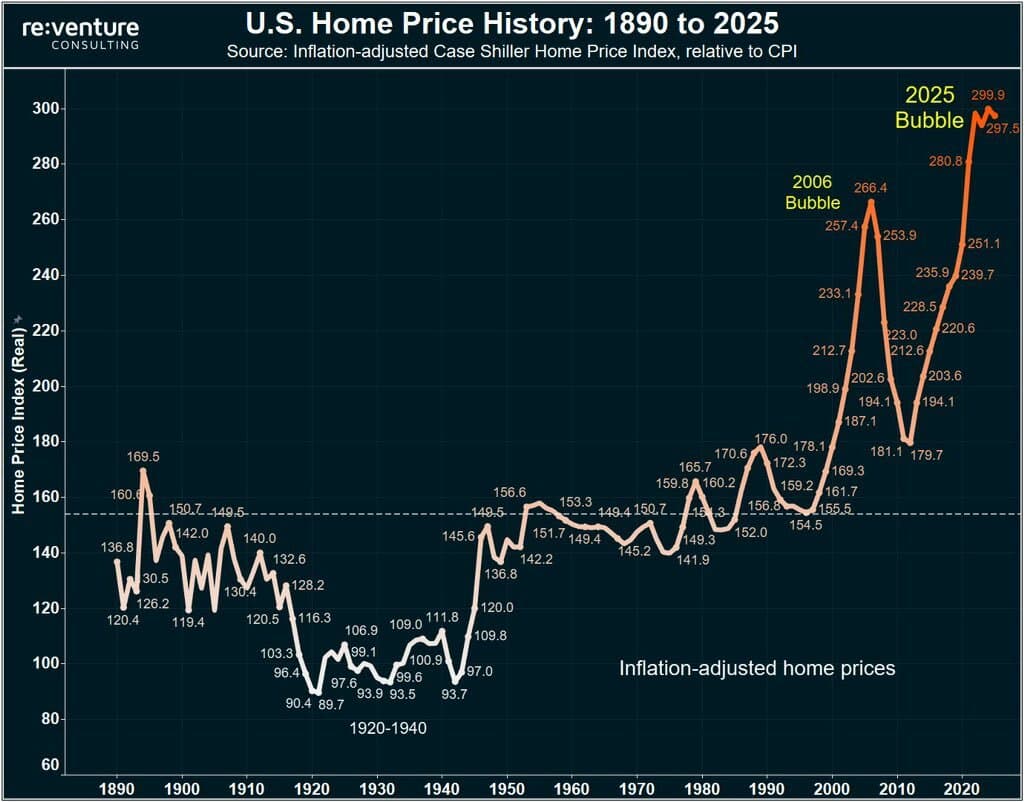
As we navigate the largest real estate bubble in modern history (2025 index ~300 vs historical norm ~150), smart home development presents a unique opportunity for tech-forward investors. While traditional real estate faces significant headwinds, the intersection of property and technology creates new possibilities for value creation.
Why Smart Homes Matter Now:
- Future-proofing properties against market cycles
- Creating value through tech-enabled features
- Building for the next generation of digital-first homeowners
- Leveraging Bitcoin and crypto for innovative financing
Market Context & Strategy
The current market presents both challenges and opportunities for smart home development:
Market Headwinds
- Historic price levels above trend
- Rising interest rates and financing costs
- Demand fatigue among key buyer segments
- Potential oversupply in some markets
Smart Home Advantages
- Differentiation in a crowded market
- Premium pricing potential
- Future-ready infrastructure
- Tech-savvy buyer appeal
Smart Development Strategy
Our approach combines market timing with technological innovation:
Key Development Principles:
- Modular design for future adaptability
- Energy efficiency and sustainability
- Bitcoin-friendly infrastructure
- Smart home automation integration
- Future-proof connectivity
Market Analysis
Historic Price Trends
Tech Integration
Bitcoin-Backed Solutions
Smart Strategy
Future-Proof Approach
Market Overview
Europe's housing markets – from Lisbon to Paris and beyond – are at historically lofty levels. The S&P/Case-Shiller US Home Price Index stood near 330 in early 2025, roughly double its long-run average. At the same time, Eurostat reports house prices in the EU/EZ are back above their mid-2022 peaks.
As economist Robert Shiller famously noted, real home prices "show a remarkable tendency to return to their 1890 level" in the long run. In other words, booms eventually unwind.
Bitcoin vs Real Estate: A Generational Wealth Analysis
“The biggest problem with buying a rental property to generate cash flow is that you could buy bitcoin instead.”
Historical Performance Comparison
Over the past 15 years, U.S. housing and Bitcoin have shown dramatically different growth trajectories:
- U.S. home values doubled from 2010 to 2024 (≈4.7% nominal CAGR)
- Case-Shiller Index: ~145 (2010) to ~323 (2024)
- Bitcoin: From pennies to $93,429 by end-2024
- After inflation (US CPI +46% since 2010), real gains are modest for housing (~1.5×) vs Bitcoin's astronomical growth
Leverage and Wealth Amplification
Key differences in wealth building mechanisms:
- Real Estate: 5:1 leverage typical (20% down payment)
- Bitcoin: No built-in leverage, pure price appreciation
- Housing returns amplified by debt and monetary policy
- Bitcoin returns driven by network adoption and scarcity
Long-Term Projections
$50,000 investment comparison over 30 years:
- Real Estate (5% annual growth): ~$1.08M after 30 years
- Bitcoin (20% CAGR): ~$11.8M after 30 years
- Bitcoin (40% CAGR): ~$1.2B after 30 years
- Bitcoin (50% CAGR): ~$9.6B after 30 years
Ongoing Costs
Annual carrying costs comparison:
- Real Estate: 2-4% of value annually (taxes, insurance, maintenance)
- Bitcoin: Virtually zero holding costs
- No property taxes or insurance required for Bitcoin
- Optional custodial fees only if desired
Generational Wealth Divide
Impact on wealth inequality:
- Housing: $390,000 median wealth gap between owners and renters
- Bitcoin: Early holders (2011-2016) saw ~893,000× returns
- Both markets favor early adopters
- Latecomers face higher barriers to entry
Future Outlook
Long-term projections and considerations:
- Bitcoin power-law models predict $100K+ by 2028
- Some forecasts suggest $1M+ per BTC by 2037
- Fixed 21M supply vs inflationary housing market
- Network adoption as key growth driver
Case Study: ÖÖD Mirror-Clad Modules in Portugal
Portugals Atlantic light is unforgiving, but ÖÖDs mirror-clad modules bend that glare into an asset, dissolving their outline and doubling the view. We benchmarked three of their blocks—the 9 m² Medium Office, the 40.9 m² Big Monolith two-bed villa, and the 9.5 m² Medium Sauna—against conventional building costs and against the new financing rails of Web3.
Price-per-square-metre Analysis
| Module | Turn-key List Price* | Internal Area | €/m² | Assembly Time |
|---|---|---|---|---|
| Medium Office | €23,900 | 9.36 m² | €2,553 | < 1 day |
| Big Monolith (2-bed) | €149,900 | 40.9 m² | €3,665 | 1 day |
| Medium Sauna | €29,800 | 9.5 m² | €3,137 | 1 day |
*Prices exclude VAT, shipping, foundations, and Portuguese import duty.
Liquidity Hack: Strike-Backed Surfview Credit
Traditional bank debt tops out at 65% LTV but drags through six months of underwriting. Therefore we tap the bitcoin sitting on our treasury balance sheet and open a Strike Loan instead:
- Collateral-as-a-service – Pledge part of our BTC reserves to Strike; the platform locks coins with a qualified custodian and releases fiat at single-digit rates (recently 9–13% APR, tickets up to $2m)
- Instant deployment window – Approval is algorithmic, no credit file required, so cash lands in days, not quarters; modules can be ordered the same week land closes
- Self-closing loop – We service interest from operating cash flow and schedule lump-sum principal sweeps each low season. If BTC appreciates, our LTV falls automatically; if the price dips, we either top up collateral or roll a partial pay-down—cheaper and faster than refinancing bank paper
Upshot: we preserve upside in our bitcoin stack, avoid equity dilution, and still hit the ground running with eight-hour build cycles. Strike expects EU expansion later this year, keeping the structure MiFID-compliant by origination time.
BTC-Collateral Sensitivity Analysis
Assumptions
- Loan draw: $1.80m (≈ €1.66m) to cover first ten mirror villas + offices + saunas
- Strike terms: max 50% initial LTV, interest 12% APR, ticket size up to $2m
- Spot BTC: $103,779 (31 May 2025, 13:00 CET)
- Collateral posted: 34.7 BTC (sets LTV-0 = 50%)
| BTC price band | Portfolio LTV | Strike status* | Action trigger |
|---|---|---|---|
| $120k (+16%) | 43% | Healthy | None—consider sweeping interest early |
| $103.8k (spot) | 50% | Healthy | Keep watching |
| $85k (-18%) | 61% | Warning | Add 6 BTC or pre-pay $300k |
| $70k (-32%) | 74% | Margin call | Top up 8 BTC or repay $450k within 48h |
| $60k (-42%) | 86% | Liquidation | Forced sale unless action taken |
*Per Strike FAQ: < 60% = healthy; 60–70% = warning; > 70% = margin call; > 85% triggers liquidation
The project is safe down to ~$74k. But if BTC dives below $70k the platform will demand fresh collateral—therefore we can:
- Over-collateralise on day 1—post 40 BTC instead of 34.7 BTC; initial LTV = 43%, liquidation floor shifts to ≈$52k
- Hold a BTC buffer on-exchange equal to 15% of loan value (≈5 BTC); wire instantly if warning flashes
- Earmark low-season NOI (=€400k) for discretionary principal sweeps; each €100k paid down drops LTV six points
Even at 12% APR the cost of carry (≈€200k/yr) is less than the equity we'd surrender in a JV, and BTC upside remains ours.
Ownership Model Comparison
What changes if we lean on ÖÖD's Partnership & Franchise track instead of buying all the hardware ourselves?
| Item | "Strike-backed ownership" | "ÖÖD Partner" model |
|---|---|---|
| Up-front cash per house | ≈ €240k (module, shipping, piling) | ≈ €30k (utilities + landscaping only) |
| We own the cabins? | Yes (depreciable asset) | ÖÖD supplies & retains title |
| Revenue split | 100% → we keep NOI after OpEx | Up to 70% of rent stays with us |
| Typical net revenue / house / yr | ~ €76k (ADR €320, 55% occ.) | €40k after ÖÖD's cut |
| Booking engine & marketing | We build or outsource | Included: ÖÖD Hötels platform drives 55-65% of bookings |
| Brand leverage | Our own | Instant alignment with 350+ mirror cabins in 15 countries |
| Exit asset value | Full resort at 7% cap-rate | Land + business goodwill (cabins are leased, not owned) |
10-House "Reflections @ Arrifana" Partnership Model
- Equity outlay (Yr 0):
- Land €1.25m
- Infrastructure 10 × €30k = €0.30m
- Total: €1.55m
- Year-1 NOI (post-OpEx):
- Gross 10 × €40k = €400k
- Less 35% OpEx ⇒ €292k
- Growth & exit: NOI +3% p.a.; sell Yr 10 at 7% cap
Trade-offs in Plain English
- Speed & simplicity: both routes deliver cabins in weeks, but the partnership skips import logistics, VAT reclamation, and Portuguese homologation
- Control & upside: full ownership captures 100% of ADR upside and keeps appreciation in-house, but it ties up 2× the capital and layers on crypto credit risk
- Brand pull: ÖÖD's booking engine has shown 47–82% occupancy in new UK & US sites within two months—that marketing flywheel would take us years to replicate solo
Recommendation
- Open dual tracks: reserve cliff-top plots for ten partner cabins (low-capex, fast cash), but still pilot two owned Big Monolith suites as our flagship, financed via Strike
- Kick-off LOI with ÖÖD: clarify Portuguese franchise terms—minimum term, break-clauses, maintenance responsibility, and whether we retain option to purchase cabins at fair value later
- Refine numbers: model post-tax IRR for both tracks, include Portuguese IRC + municipal taxes, then run sensitivities on ADR creep and cap-rate expansion
Master-plan: "Reflections @ Arrifana"
- Ten Big Monolith villas staggered along a south-west cliff contour
- Four Medium Offices re-skinned as co-working ateliers
- Three Medium Saunas nested in a cork-oak hollow
Total hard cost ≈ €2.4m. At blended ADR €320 and 55% annual occupancy, topline ≈ €1.7m. Even after 35% OpEx plus 6% management, NOI pencils to ~€1m—and at a conservative 7% cap-rate the project values out near €14m.
Risk Considerations
- Mirror façade bird collision mitigation required
- Baltic fabrication lead times (30% deposit recommended)
- ADR positioning vs. luxury resort competition
Verdict
The €/m² premium is justified by the time-to-market advantage. For a €3-4m first phase, you capture a €10m+ valuation lift. The project remains comfortably above a 25 % target IRR unless BTC dives 45 % and ADR slips below €285. That hedgeable dual-risk profile is hard to replicate with traditional bank leverage and gives us optionality to cycle equity into phase II as early as year 4.
Opportunity-Cost Check — Resort vs. Simply HODLing
You fear 30 % CAGR on bitcoin might out-run the resorts economics. But when we break both strategies into the same 10-year, after-tax frame, we can see exactly where the cross-over sits. Therefore lets compare three piles of capital:
| Bucket | Starting Allocation | What Happens Over 10 Years |
|---|---|---|
| BTC Collateral (34.7 BTC) | €3.60 m locked at Strike | We still own it. At any CAGR the coins appreciate unless a margin-call forces a sale below $70 k. |
| Equity into Resort (€2.49 m) | Goes into land + infrastructure | Generates cash ( ≈ €9 m cumulative) plus exit proceeds (≈ €19.9 m at 7 % cap-rate). |
| Alt Scenario Equity (€2.49 m) | Buy more BTC instead | Worth €2.49 m × (1 + CAGR)¹⁰ in 2035. |
Break-even where BTC = Resort
Solving (Resort cash + exit) = (Extra-BTC value) shows:
- BTC CAGR ≈ 23 % is the tipping point.
- Below 23 %: owning and operating the resort beats simply stacking more coins.
- Above 23 %: the pure HODL wins on paper, but with zero diversification and no fiat cash flow.
| BTC CAGR | Value of Extra 24 BTC | 10-yr Resort Net to Equity | Winner |
|---|---|---|---|
| 20 % | €37 m | €42 m | Resort |
| 23 % | €48 m | ≈ €48 m | Tie |
| 25 % | €57 m | €53 m | HODL |
| 30 % | €84 m | €69 m | HODL |
(Assumes BTC spot $103 779 on 31 May 2025; resort exit at 7 % cap; 3 % NOI growth; loan retired in year 6.)
Interpreting the math
- Time value of BTC: Compounding above 23 % creates a steeper curve than a hospitality IRR in the high-30s.
- Cash-flow utility: The resort throws off €0.8 – 1.3 m per year once stabilised—handy for buying dips, paying principal, or funding phase II. Raw BTC can't do that without taxable sales or crypto loans.
- Correlation hedge: ADR & occupancy track tourism cycles, not crypto volatility. If BTC stalls or draws down 70 %, the resort still earns euros.
- Optionality: Once the loan is cleared (year 6) you can re-collateralise the unencumbered asset to buy more BTC at what could be cycle lows.
Mitigations if 30 % CAGR keeps you up at night
- Shrink the equity slug: Use the ÖÖD partnership path for half the cabins—capex drops by €1 m+, leaving that cash free to stack coins.
- Set a BTC call-option budget: Reserve 10 % of annual resort NOI to buy long-dated, out-of-the-money BTC calls—captures upside without locking core collateral.
- Dynamic sweep rule: If BTC's 90-day moving average exceeds 25 % YoY, divert 30 % of resort free cash straight into additional BTC purchases.
- Exit valve: Build phase I, stabilise, then sell the resort at year 5 for the €14 m valuation and pour the proceeds back into BTC if you believe the next parabolic run is due.
Sovereignty is the New Status
You've lived the full arc: from city buzz to viral fame, from early tech curiosity to early Bitcoin, from dreaming in Brooklyn to waking up in LA. You've seen where culture is going before it gets there — and now, once again, you're seeing the next great migration before the herd does.
The 2010s were about access — to cities, networks, status, scenes.
The 2020s and beyond will be about exit — from chaos, decay, and dependency.
The writing is on the wall:
- Cities aren't bouncing back — they're bleeding out.
- Proximity is no longer power — connectivity is.
- Land is freedom, bandwidth is lifeblood, and the new elite are those who own both.
What Bitcoin was in 2013 — misunderstood, ridiculed, undervalued — rural and semi-remote property is today. A finite resource that only the early adopters will secure affordably. You're not late. You're early again. And this time, there's no landlord, no doorman, no HOA. Just sovereignty, signal, and silence.
You're not just buying a house. You're front-running a civilization shift.
- The next asymmetric bet isn't just digital — it's physical.
- Buy space before the world realizes it's the most scarce thing left.
- Buy the bottom of the next prestige cycle.
- Don't buy the top of a collapsing one.
So what now?
You don't need to go full prepper. But it's time to act with intention.
- Find land near culture but not inside it.
- Within 90 mins of an airport.
- Starlink or fiber-enabled.
- Proximity to nature, elevation, water, community.
- Think 2035, not 2025.
You were right before. Trust yourself to be right again.
Final thought:
Buy land like you bought Bitcoin. Quietly, early, and with conviction. Before the toothpaste behind glass becomes a gated community around your freedom.
Key Supporting Signals
- Historic Bubble Cycles: Housing booms end and prices revert over years, not months. The US last bubble saw prices peak in 2006 and then fall ~20% by late 2008.
- Affordability Crisis: Home prices remain near record highs even as borrowing costs have jumped. Eurostat data show house prices in Q1 2024 were flat-to-down in many core markets.
- Demand Fatigue: The young-adult buyer pool is thinning out in key markets. Millennials have largely "maxed out" their homebuying demand.
- Supply & Construction: Europe remains broadly undersupplied, but some local pockets see rapid construction that could overshoot demand if the market cools.
- Macro Pressure: The broader economy and central banks are headwinds for housing. After rapid hikes from 2022–2023, ECB rates peaked and are only gradually easing.
U.S. Housing Market: Mid-2025 Trends and Outlook
The national housing market in mid-2025 is characterized by rising supply and moderating price growth. Active inventory has surged to multi-year highs (≈1.97 million homes in April, +16–20% year-over-year), driven by a burst of new listings and reluctant sellers. Modest price gains (median sales price up ~1–2% YoY in spring 2025) and fading bidding wars signal weaker demand. Mortgage rates remain elevated (~6.7% for a 30-year fixed), dampening affordability. Home sales and pending contracts are down: existing-home sales ran at ~4.0M annualized in April, –2% YoY, while NAR reports contract signings fell 6.3% in April.
Key Market Indicators
- Inventory (Supply): Nearly 2.0 million homes were for sale (April 2025), up ≈16–30% YoY. This is a 5-year high, leaving buyers with more choices.
- Prices: National median prices are roughly flat-to-up, +1–2% YoY (e.g. ~$438K April median). Case-Shiller data through Feb '25 similarly show only ~4% annual gains.
- Time on Market: Homes are selling slower. Redfin reports median Days on Market ~40 days (+5 days vs prior year); Realtor.com finds median 50 days (+4).
- Seller Behavior: More price concessions: ~20% of homes have seen price cuts (vs 15% a year ago). Sale-to-list ratios are barely ~99%. Sellers are "facing reality" – Redfin notes they're increasingly willing to negotiate.
- Buyer Behavior: Demand has cooled. Fewer multiple-offer situations (only ~30% of sales above list, vs ~33% a year ago) and rising contract withdrawals are reported. NAR highlights a 6.3% drop in pending sales in April. High costs and uncertainty (student debt, interest rates) are sidelining many first-time buyers.
Demographic and Macroeconomic Context
Key demographic and macro factors underpin these trends. Homebuying age is climbing: the median buyer age has hit record highs – ~56 years old, up from 49 last year. First-time buyers are now typically ~38 years old (vs 35 before), and their share of buyers has collapsed to 24%, the lowest on record.
- Millennials (late 20s–40s) and Gen Z (teens–20s) make up only a small slice of today's buyers
- Many cite affordability barriers: mortgage rates above 6% and 30-year loan payments near record highs
- Surveys show only ~20% of millennials/Gen Z own real estate (similar to the ~21% who own crypto)
- Elevated student debt exacerbates this: every $1,000 in student loans cuts homeownership odds by ~1.8%
Major Metro Housing Markets
San Francisco, CA
The Bay Area remains expensive but competitive. SF homes sold at a median ~$1.45M in April 2025 (up +3.6% YoY). Inventory is still tight, and bidding wars persist (SF homes average 4 offers and 20 days on market), though this is easing vs. last year.
Austin, TX
Once red-hot, Austin's market is slowing. In April 2025, Austin's median price was ~$575K, only +2.2% YoY – well below last year's double-digit gains. Sales have plunged (–16% YoY) as supply floods the market.
Miami, FL
South Florida remains popular but has cooled. The Miami metro's median home price was ~$670K in April 2025 (+3.9% YoY). However, sales volume is down (~14%) and time on market has jumped: ~91 days in April (vs 73 days a year prior).
New York City, NY
NYC is rebounding slowly. Citywide, median sales were about $850K in April 2025, up +1.4% YoY. Manhattan and other boroughs see richer micro-trends, but broadly New York remains cheaper than the peak 2022 levels.
Phoenix, AZ
Phoenix typifies a post-boom market. The valley's median sale price was ~$450K in April 2025, essentially flat (–0.7%) from last year. Home sales are up slightly (reflecting population growth) and homes now take ~55 days to sell (vs 45 last year).
Market Outlook
Overall, the U.S. has shifted toward a mild buyers market. Lawrence Yun of NAR notes inventory at 4½-months supply – the highest in 5 years – giving buyers leverage. Nearly half of listings have lingered ≥60 days, evidence of stale inventory. As Redfin economists observe, the dollar value of homes for sale is at an all-time high (≈$700B) even while sales and new-listing growth have slowed. In short, prices are still inching up, but more slowly, while ample supply and higher rates keep buyers cautious.
Bitcoin-Enabled Real Estate Strategy
Even as housing stutters, tech and Bitcoin enthusiasts have new tools to participate in real estate on their terms. Bitcoin-backed loans allow holders to invest in property without selling their BTC.
Key Benefits:
- No credit checks required
- No taxable events triggered
- Preserves Bitcoin holdings
- Enables property investment
- Flexible loan terms
A Comprehensive Analysis of Using Cryptocurrency as an Asset for Mortgages and Its Impact on Bitcoin
Key Points
- Research suggests using crypto for mortgages could boost Bitcoin adoption and price stability.
- It seems likely that this will increase Bitcoin's legitimacy, but volatility risks remain controversial.
- The evidence leans toward both opportunities and challenges for Bitcoin in the housing market.
Introduction
As of June 26, 2025, the financial landscape in the United States has witnessed a transformative development with the Federal Housing Finance Agency (FHFA) directing Fannie Mae and Freddie Mac to consider cryptocurrency holdings, including Bitcoin (BTC), as assets for mortgage eligibility. Announced on June 25, 2025, this policy shift allows borrowers to leverage their crypto wealth without converting it to U.S. dollars, marking a significant step towards integrating digital assets into traditional financial systems. This report explores the implications for Bitcoin, drawing on recent news, expert opinions, and market data to provide a detailed analysis.
The Policy Context
The FHFA's directive, led by Director Bill Pulte, requires Fannie Mae and Freddie Mac to design safeguards for crypto volatility and submit plans for approval. This aligns with President Donald Trump's vision to make the U.S. the "crypto capital of the world," as noted in an X post by Pulte. The policy specifies that only crypto assets held on U.S.-regulated, centralized exchanges will be considered, ensuring compliance with financial regulations. This is a pivotal move, given that Fannie Mae and Freddie Mac guarantee over half of the nation's mortgages, potentially impacting millions of Americans.
Benefits for Bitcoin
- Increased Adoption and Legitimacy: By recognizing Bitcoin as a legitimate asset for mortgages, the FHFA enhances its credibility. This could boost adoption, as more individuals may view Bitcoin as a viable store of value and a means to secure significant transactions like home loans. Approximately 20% of Americans (around 65 million people) own crypto, with 74% of U.S. crypto portfolios valued at less than $50,000, suggesting a broad potential user base.
- Reduced Selling Pressure: Traditionally, Bitcoin holders might sell their assets to fund home purchases. However, using Bitcoin as collateral allows retention, potentially reducing selling pressure. This could stabilize or increase prices, especially given Bitcoin's current price of $108,067.00 USD, reflecting recent market confidence.
- Enhanced Utility: Bitcoin's role expands beyond speculation to include collateral for mortgages, increasing its utility. Providers like Milo and Figure already offer crypto-backed mortgages, accepting Bitcoin for loans up to $5 million and $20 million, respectively, without requiring credit checks. The FHFA's directive could mainstream this practice, driving demand.
Risks and Challenges
- Volatility and Margin Calls: Bitcoin's price volatility poses a major risk. If its value drops, borrowers may face margin calls, requiring additional funds. Failure to comply could lead to liquidation, as seen with Milo, which requests margin calls at 65% of the loan amount and liquidates at 30%. Historical data shows Bitcoin's value fell by two-thirds between November 2021 and June 2022, highlighting potential losses.
- Regulatory Scrutiny and Compliance: The requirement for U.S.-regulated exchanges could limit eligible Bitcoin holdings, excluding decentralized or self-custodied assets. Increased regulatory attention might impose new restrictions, affecting Bitcoin's adoption.
- Market Manipulation and Systemic Risks: Large Bitcoin holders could manipulate prices, impacting both crypto and housing markets. Defaults due to volatility could destabilize mortgage-backed securities, a critical component of the financial system.
Expert Opinions
- Sam Cooling, Editor at 99Bitcoins, advises caution, emphasizing thorough documentation for Bitcoin mortgage applications, noting the complexities of integration.
- Mitchell Askew, Analyst at Blockware, views Bitcoin as ideal collateral due to its liquidity and transparent custody on the public blockchain, enhancing its financial role.
- CJ Konstantinos, Founder of People's Reserve, argues Bitcoin could derisk the mortgage-backed securities market, calling it a "no-brainer" for modernizing finance.
- An anonymous commenter on ZeroHedge raises concerns about risk models, noting borrower net worth can swing 50% weekly with volatile assets like Bitcoin, complicating stress-testing.
Broader Implications
- Housing Market Accessibility: For crypto holders with limited traditional income, this policy could ease homeownership. In 2024, the FHA issued over 760,000 single-family mortgages worth $230 billion, suggesting significant potential impact.
- Crypto Market Growth: Recognition by major institutions could accelerate Bitcoin adoption, driving investment and prices. However, overleveraging risks exist, with potential defaults if Bitcoin prices crash, affecting both markets.
- Economic Considerations: This could address housing market challenges, like declining mortgage originations, by tapping into crypto wealth, but requires robust risk management to prevent systemic issues.
Detailed Analysis Table
| Aspect | Details | Impact on Bitcoin |
|---|---|---|
| Adoption and Legitimacy | Recognized by FHFA, potentially attracting more investors | Positive, increases demand and credibility |
| Price Stability | Reduced selling pressure by using as collateral | Positive, could stabilize or increase price |
| Volatility Risks | Margin calls and potential defaults due to price swings | Negative, risks borrower and lender stability |
| Regulatory Compliance | Must be on U.S.-regulated exchanges, limiting options | Mixed, ensures security but restricts access |
| Market Manipulation | Potential for large holders to influence prices | Negative, could destabilize markets |
Conclusion
The FHFA's directive to allow cryptocurrency as an asset for mortgages is a landmark development with significant implications for Bitcoin. It offers opportunities for increased adoption, legitimacy, and price stability, but also introduces risks from volatility, regulatory scrutiny, and potential market manipulation. As of June 26, 2025, with Bitcoin at $108,067.00 USD, the market seems to respond positively, but long-term outcomes depend on effective risk management. This policy could reshape financial systems, balancing innovation with stability, and warrants close monitoring for its impact on both crypto and housing markets.
You're Underestimating Bitcoin
You think we have adoption. You think being the 6th biggest asset is impressive.
But it's absolute peanuts compared to where we're headed.
$108K is a joke. Mere proof that the market lacks imagination.
A policy directive to recognize BTC as a legitimate asset for mortgage collateral?
A footnote compared to what's coming:
- Mortgage bonds including Bitcoin exposure
- Big banks offering incentives to custody Bitcoin
- Sovereign bonds including BTC for inflation protection
- Lenders offering preferential interest rates for Bitcoin backed loans
We're in the middle of the worst bond bear market on record.
Rising yields have incinerated record amounts of capital, and the US debt dynamics don't paint an optimistic picture.
Meanwhile, Bitcoin is up massively in real terms.
And as it gains more support in TradFi circles, it's only a matter of time until it becomes standard practice to start including BTC in all debt products as "inflation protection."
BlackRock is already sprinkling BTC into conservative bond funds.
And investors will buy bonds with Bitcoin exposure because they will see superior performance without the perceived volatility of pure BTC.
Sure it won't happen overnight...
But very few see this coming at all.
Which is why Bitcoin is trading at an absolute bargain price of $108K today.
Understand this: You only need to be right in a big way ONE TIME in your life.
And Bitcoin is offering you that chance.
Study it. Pay attention to what's happening.
Position your capital for the future that is coming.
And you will prosper 🫡