Bitcoin Cycles • Market Analysis • Price Projections
Max Pain
Understanding Bitcoin's Market Cycles
The 2-Year Moving Average Multiplier
Loading Real-Time Data...
A RECESSION IS COMING. ARE YOU READY?
The clock is ticking. By the end of 2025 or early 2026, the economic storm will hit. Most people? They'll be caught off guard—unprepared, overwhelmed, and outmaneuvered. But not me. I'm ready. And I want you to be too.
My goal this cycle? Simple: Sell the top. Buy the bottom. No guesswork. No emotions. Just a proven strategy that's worked in every crypto cycle since 2013. The key? The 2-Year Moving Average Multiplier. It's not hype—it's data.
Here's how it works:
🔴 The Red Line (2Y MA x5): Every time Bitcoin hits this level, the bull run ends. The market tops out. That's when I sell. No hesitation. This has called every peak—2014, 2017, 2021. It's the exit signal you can't ignore.
🟢 The Green Line (2Y MA): When Bitcoin drops below this line, it's the bottom. The reload zone. The wealth transfer moment. This is where I buy back in—big. It nailed the lows in 2014, 2017, and 2021. Every. Single. Time.
My plan is crystal clear:
- Sell at the red line. Lock in profits.
- Buy below the green line. Build wealth for the next cycle.
No noise. No speculation. Just cold, hard data guiding every move.
When the time comes to exit, I'll be shouting it from the rooftops. When it's time to buy back in, you'll hear me even louder. Follow the lines, and you're in control. Ignore them, and you're someone else's exit liquidity.
Follow me. Let's ride this cycle together—buying bottoms, not chasing tops. The recession's coming, but we'll be ready.
📜 Crypto's Wildest Whiplash Years
Crypto history reads like a storyboard where every frame begins with euphoria but ends with a plot-twist that re-writes the rules of the game. Each cycle we survive forges a harder, savvier industry. Below is a whirlwind tour of the loudest boom-and-bust chapters.
2012-2014 | The Prototype Roller-Coaster
Bitcoin's first halving on 28 Nov 2012 slashed block rewards from 50 to 25 BTC. When new money arrived in spring 2013, price discovery was violent: $13 → $266 in April, followed by a sprint to ~$1,150 by November. Mt. Gox's February 2014 collapse vaporized ~850,000 BTC, teaching two enduring lessons: "Not your keys, not your coins" and "Liquidity vanishes when you need it most."
Q4 2017 | ICO Fever Dream
Bitcoin blasted through prior ATHs as token sales raised billions on white-papers and Telegram rooms. When BTC kissed $20k on 17 Dec 2017, retail investors FOMO-ed into every ticker ending in "-coin." Two months later, the market erased ~70% and taught everyone the meaning of "vaporware."
DeFi Summer (Aug 2020)
COVID-era stimulus cash chased yield. Compound turned "liquidity mining" from esoteric hack to mainstream motif. TVL rocketed from $1B → $10B in 90 days, but gas fees spiked and rugs multiplied, pushing Layer-2 roadmaps to the front.
2021 | The NFT Revolution
From NBA Top Shot's $40M weekend to CryptoPunks' seven-figure bids, NFTs went from fringe to front-page. Art Blocks and Sotheby's hammer prices forced even skeptics to admit culture had merged with code.
The Meta-Takeaway
Every surge begins with scarcity or storytelling, but unsustainable leverage, product-market fiction, or regulatory whiplash always crash the party. The only constant is cyclicality itself: HODLers survive, infrastructure hardens, and the next wave rides on the ashes of the last.
Bitcoin Cycle Forecast
Historical Cycle Analysis
🔁 Historical Cycle Bottoms (Log Scale Adjusted):
2014–2017: $176 → ~$20,000 (~113x)
2018–2021: $3,185 → ~$69,000 (~21x)
2022–2025: $15,758 → TBD (~$250k-1M?)
📉 Projected 2026–2029 Cycle Bottom
Step 1: Use Halving Logic
- Halvings tend to trigger parabolic tops ~12–18 months after
- Bottoms occur ~12 months after the top, typically during post-hype capitulation
Step 2: Log-Adjusted Pattern
If the diminishing returns continue:
- 2017 Top to 2018 Bottom: ~84% drop
- 2021 Top to 2022 Bottom: ~77% drop
Let's assume an average future drawdown of 75–80% from the next top.
Step 3: Estimate
If this cycle tops out at:
- $250,000, then an 80% drop = ~$50,000
- $500,000, then 80% drop = ~$100,000
- $1,000,000, then 80% drop = ~$200,000
📍 Realistic Prediction for 2026–2029 Bottom
Based on historical analogs and current trajectory:
🧠 Cycle Bottom (2026–2029): $50,000–$120,000
(Assuming a top between $250k–$500k and ~75–80% correction)
🐻 2030–2033 Bitcoin Cycle Bottom Forecast
Alright, let's forecast the 2030–2033 Bitcoin cycle bottom, using the same logical framework but extrapolating further out based on diminishing returns, halving cycles, and macro adoption S-curves.
🧠 Context Recap:
- Each cycle = ~4 years
- Tops happen ~1 year post-halving
- Bottoms happen ~1 year post-top
- Returns diminish each cycle: 113x → 21x → (likely 10x this cycle)
- Drawdowns from top: 84% → 77% → likely 70–75%
🔮 Step-by-Step Projection for 2030–2033
- Cycle Start Date
- If 2025 is the top of the current cycle, the next bottom is expected ~2026–2027
- That puts the next halving around 2028, with a top likely in 2029–2030
- Therefore, the 2030–2033 period includes the post-2030 top drawdown phase
- Estimate the Top for the 2026–2029 Cycle
Using our last bottom forecast ($50K–$120K):
Assume a more mature, adoption-stabilized cycle:
- Modest gain: 5x–7x from 2026–2027 bottom
→ Top in 2029–2030 = $250K–$800K
- Apply Drawdown Assumption (70% decline)
Top Price (2029–2030) 70% Drop = Predicted Bottom $250,000 $75,000 $500,000 $150,000 $800,000 $240,000
✅ 2030–2033 Bottom Projection:
$75,000 – $240,000, depending on how the 2029–2030 top plays out.
🧠 Extra Notes:
- By then, Bitcoin may be priced in satoshis, with widespread Lightning adoption.
- Sovereign adoption and institutional custody rails could flatten volatility.
- The bottom might not be as deep as before if BTC is used as collateral and base layer more than as a speculative asset.
📊 Bitcoin Market Cycle Summary
Key Points
- Bitcoin's price may reach $150,000–$200,000 by end of 2025
- Long-term growth could see prices in hundreds of thousands to millions by 2030
- Diminishing volatility in cycles suggests milder drawdowns as Bitcoin matures
- Recent drawdown of ~76.9% (2021-24) vs historical 86-93% shows market maturity
Current Context (June 2025)
- Trading at ~$104,319, near ATH of $111,814
- Strong momentum post-April 2024 halving
- Historically, bull runs peak 12–18 months after halving
- Expected peak: late 2025 or early 2026
Historical Cycles
2012-13 Cycle
- Peak: $1,152 (Nov 2013)
- Bottom: $150 (Jan 2015)
- ~12 months post-halving
2016-17 Cycle
- Peak: $19,188 (Dec 2017)
- Bottom: $3,236 (Dec 2018)
- ~17 months post-halving
2020-21 Cycle
- Peak: $69,000 (Nov 2021)
- Bottom: $15,787 (Nov 2022)
- Milder drawdown: ~77%
2024-25 Cycle
- Current: $104,319
- Expected peak: Late 2025
- Projected: $150k-$200k
Institutional Adoption
ETF Growth
- $27.4B in U.S. Bitcoin ETFs (Q4 2024)
- 114% QoQ growth
- 26.3% of ETF market share
- Projected: 7-15% of BTC supply by 2033
Sovereign Adoption
- El Salvador (2021)
- Central African Republic (2022)
- U.S. Strategic Bitcoin Reserve (2025)
Price Forecast Models
2025 Forecasts
- Bernstein: $200k (ETF flows)
- PlanB: $160k (doubling trend)
- Changelly: $210k-$230k
- Consensus: $150k-$200k
2030+ Forecasts
- ARK Invest: $300k-$1.5M
- Fidelity: $1B by 2040
- Willy Woo: Mid-6-figures (8% CAGR)
- Cane Island: $1-10M by 2050
Macroeconomic Context
- Cycles align with global liquidity and inflation trends
- 2020–21 rally coincided with stimulus and 5–7% inflation
- 2022 drawdown overlapped with Fed rate hikes
- Expected easing by 2025–2026 could catalyze next bull run
- Geopolitical factors may impact short-term volatility
📈 Bitcoin Market Cycles Visualization
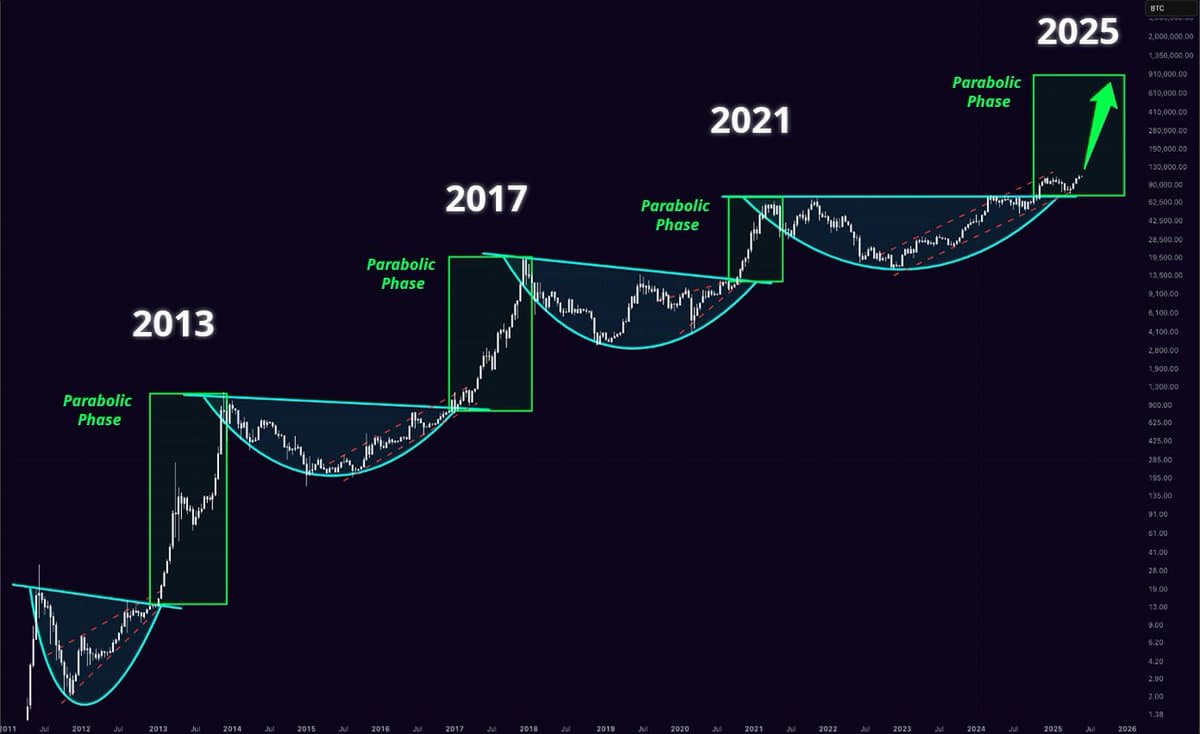
Historical Bitcoin cycles and projected future patterns based on halving events and market adoption
🐻 DCA OUT / DCA BACK IN Strategy
Here's a strategic action plan for when BTC crosses $145K, assuming we want to exit near the top and avoid a 60–70% drawdown (like prior cycles). This plan blends on-chain signals, macro indicators, and execution discipline.
🎯 Goal
Exit most or all of our BTC exposure between $145K–$220K, ahead of a potential reversion to $45K–$75K.
✅ Action Plan: BTC > $145K
1. Exit in Tranches
🧠 Avoid single-point exits. Use volatility to your advantage.
- $145K–160K: Start trimming 10–20%
- $160K–180K: Sell 20–30%
- $180K–200K: Sell 30–40%
- > $200K: Final 10–20% if blow-off top confirmed
Use TWAP/limit orders to scale out with less slippage.
2. Watch On-Chain Top Signals
High conviction indicators of overheated markets:
- 📈 MVRV Z-Score > 7
- 🔥 Realized Profit Spikes
- 📊 Exchange inflows surge
- 🟧 Dormant BTC waking up (HODL waves thinning)
- 💸 Funding rates spike (perpetual swaps)
Set alerts using Glassnode, CryptoQuant, or Arkham.
3. Monitor Macro Catalysts
Fed pivot or liquidity reversal can be the kill switch.
- 🏦 Fed restarting hikes or QT = bad
- 🛢️ Inflation re-accelerating = bearish
- 💳 Credit markets tightening = risk-off
- 📉 DXY + yields up = BTC down
Use macro dashboards (e.g. TradingView, FRED, ZeroHedge AI feeds).
4. Rotate Capital Into Bear-Resistant Buckets
If conviction in long-term BTC remains, protect capital:
Options:
- 🧊 Stables with yield: USDC, T-bill backed on-chain
- 🔄 Rotate into ETH/AI/infra plays with lower blow-off top risk
- 🏡 Off-ramp into real-world assets: Property, BTC-funded businesses
- 🧱 Cold storage BTC: Wait for next bottom to reaccumulate
5. Leave Dry Powder for Re-entry
Historically, best entries come 9–15 months post-top.
- Target rebuy zone: $45K–$75K
- Set automated limit orders and notifications
- Use DCA for re-entry once macro + on-chain align
6. Hedge Against Downside Risk
Protect your portfolio with strategic hedging across on-chain and TradFi:
On-Chain Hedging:
- Platforms: Lyra, Dopex, Premia, Ribbon Finance
- Buy Put Options when BTC is above $130K
- Example: 1-month $150K put ≈ $2.5K premium
- Max 1-2% of portfolio in monthly premiums
TradFi Hedging:
- BITI: ProShares Inverse BTC ETF
- Put options on BITO/GBTC/IBIT
- Target 1x exposure when BTC is above $145K
- Ladder 30-60-90D puts at various strikes
Hedging Triggers:
- $130K: Start hedging with laddered puts
- $145K-$160K: Add BITI + deeper OTM puts
- >$180K: Maximum downside protection
- Watch IV < 60% for optimal entry
Advanced Strategies:
- Put Spreads: Long $160K put / Short $120K put
- Straddles for volatility plays
- Auto-rolling vaults on Ribbon
- Monitor Greeks.Live, Laevitas for IV
7. Key Metrics & Risk Management
Monitor these critical indicators to optimize your hedging strategy:
Market Health Indicators:
- SOPR: Spent Output Profit Ratio (peaking = profit-taking)
- MVRV: Above 2.5 indicates overvaluation
- Funding Rates: High rates = over-leveraged markets
- Implied Volatility: Target < 60% for optimal entry
Risk Management Rules:
- Limit premium costs to 1-2% of portfolio monthly
- Set stop-losses on all hedging positions
- Diversify across multiple strike prices
- Maintain dry powder for adjustments
Macro Triggers:
- Fed policy shifts (tightening = maintain hedges)
- Inflation acceleration signals
- Credit market stress indicators
- DXY and yield movements
Portfolio Protection Checklist:
- Regular IV monitoring (Greeks.Live, Laevitas)
- Monthly strategy reassessment
- Position size adjustments based on market conditions
- Documentation of all hedging decisions
🎯 Strategy Optimization
Current Price
Loading...
24h Change
Loading...
Market Cap
Loading...
24h Volume
Loading...
HODL (8.1% annualized): Compounding at 8.1% per year (20-Year S&P 500 CAGR).
HODL (14.5% annualized): Compounding at 14.5% per year (Current BTC CAGR).
HODL (36% annualized): Compounding at 36% per year (Historical BTC Growth).